
Entertainment · Canada
How Much Should a Canadian Household Spend on Entertainment?
There is no official right amount, but you can compare with what Canadians actually spend. Statistics Canada's Survey of Household Spending puts the average household's recreation spending at $5,175 in 2023, about $431 a month and roughly 6.8% of total current consumption. Within that, the narrower entertainment category, which covers things like movies, live events and museums, averaged $880, or about $73 a month. The best budget starts from your own last three months: total what you spent, split fixed costs such as subscriptions from outings, and set a monthly cap you can keep.
Key takeaways
- Average household recreation spending: $5,175 in 2023, about $431 a month.
- That is about 6.8% of the average household's $76,146 in current consumption.
- Entertainment, the narrower category, averaged $880 a year, about $73 a month.
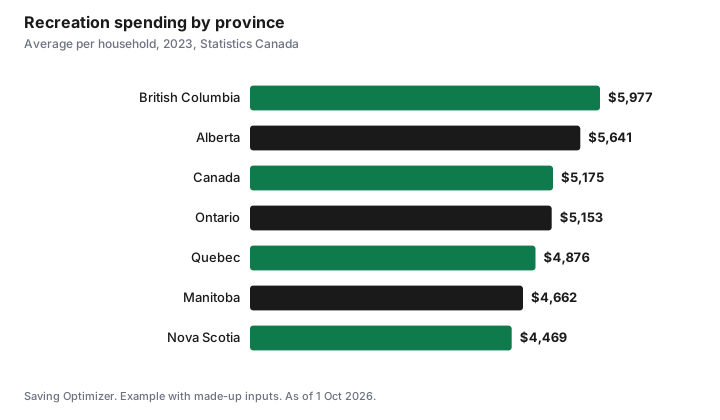
- British Columbia and Alberta households spent the most on recreation.
- Set your budget from your own last three months, not from an average.
- Example with made-up inputs: a $520 month becomes a $380 cap.
What Canadians spend
These figures are from Statistics Canada table 11-10-0222-01, Household spending, Canada, regions and provinces. The 2023 data were re-released on 18 September 2026 with survey weights calibrated to the 2021 Census, so they differ slightly from the first 2023 release. Recreation is a broad category: it includes recreational vehicles, equipment and services, not just outings.
| Category | Per year | Per month |
|---|---|---|
| Recreation (total) | $5,175 | $431 |
| Recreational services | $2,549 | $212 |
| Recreational equipment and related services | $1,427 | $119 |
| Recreational vehicles and associated services | $901 | $75 |
| Entertainment | $880 | $73 |
| Use of recreational facilities and other recreational fees | $474 | $40 |
| Home entertainment equipment and services | $297 | $25 |
| Reading materials and other printed matter | $193 | $16 |
The monthly column is the yearly figure divided by 12, rounded. Averages include households that spend nothing in a category and households that spend a lot, so a typical household may be well above or below in any one line.
Inside the entertainment category
| Item | Per year |
|---|---|
| Live sporting and performing arts events | $197 |
| Movie theatres | $64 |
| Admission to museums, zoos and other sites | $60 |
| Dues and fees for sports and recreational activities and facilities | $387 |
| Video game systems and accessories (excluding for computers) | $67 |
Live events are the largest single entertainment line, which matches what many households find: one concert or game can equal several months of streaming. If your spending is high, look there first. See ticket fees and all-in pricing.
Home entertainment is smaller than many expect at the national level: $297 a year on average, of which $260 is equipment such as TVs and audio, and $37 is services, as Statistics Canada classifies them. Streaming and other subscriptions may be counted elsewhere in the survey, so do not read the $37 as a typical streaming bill. Your own statements are the better guide for that line.
By province
| Province | Recreation | Entertainment |
|---|---|---|
| British Columbia | $5,977 | $859 |
| Alberta | $5,641 | $1,067 |
| Ontario | $5,153 | $910 |
| Quebec | $4,876 | $767 |
| Manitoba | $4,662 | $915 |
| Nova Scotia | $4,469 | $790 |
| Canada | $5,175 | $880 |
Alberta households spent the most on entertainment, $1,067, and British Columbia households the most on recreation overall. Differences reflect incomes, prices and what is nearby, so use your province as a rough guide only.
Setting your own budget
Averages tell you what is common, not what is right for you. A better method is to look at your own spending. Pull three months of bank and card statements and list every entertainment-related charge. Then sort them into fixed and variable.
| Type | Examples | How to control it |
|---|---|---|
| Fixed | Streaming, gaming subscriptions, gym or club memberships, season passes | Audit and cancel; rotate services |
| Variable, planned | Concerts, games, shows, dinners out tied to events | Book fewer, earlier; use a cap |
| Variable, impulse | In-game purchases, last-minute tickets, rentals | Remove saved cards; wait 24 hours |
| Hobbies | Supplies, classes, equipment | Buy used; use the library |
Add up the monthly average of each type. Decide which fixed costs you would keep if you started from zero, then set a monthly cap for variable spending. Many households find a separate account or prepaid card for entertainment keeps the cap visible. For subscriptions, see a household subscription budget cap.
Where entertainment fits in the whole budget
Entertainment competes with every other want, so decide it alongside them rather than alone. If you use the 50/30/20 method, entertainment sits in the wants share with dining out, travel and shopping; raising one means lowering another. See the 50/30/20 budget adjusted for Canadian cities. If you use zero-based budgeting, give entertainment its own line each month and assign every dollar before the month starts; see zero-based budgeting.
Two signs the entertainment budget is too high: you are carrying a credit card balance while spending on outings, or you are not putting anything toward an emergency fund. In either case, cut variable entertainment first and keep one or two low-cost habits you value, so the budget lasts.
Cutting without losing the fun
| Instead of | Try | Where to look |
|---|---|---|
| Several streaming services at once | One at a time, rotated | Rotate streaming services guide |
| Full-price museum tickets | Free evenings or library passes | Museum and library websites |
| Last-minute event tickets | Fewer events, booked early | Primary seller presales |
| New hobby gear | Used gear or library lending | Marketplaces and libraries |
| Paid gaming add-ons | Free-to-play or sale titles | Store sale calendars |
Example with made-up inputs: from tracking to a cap
These numbers are an example with made-up inputs. A couple's three-month average is $520 a month: $95 in subscriptions, $60 in gym memberships, $210 in concerts and games, $90 in restaurant meals tied to outings and $65 in impulse purchases. They cancel two subscriptions they rarely use, saving $30, plan one ticketed event a month instead of two, saving $85, and remove saved cards from game stores, cutting impulse spending to $40. New cap: $380 a month, about $4,560 a year.
| Line | Before | After |
|---|---|---|
| Subscriptions | $95 | $65 |
| Gym memberships | $60 | $60 |
| Concerts and games | $210 | $125 |
| Meals tied to outings | $90 | $90 |
| Impulse purchases | $65 | $40 |
| Total | $520 | $380 |
Steps
- Download three months of statements.
- List every entertainment charge and sort into fixed, planned, impulse and hobbies.
- Compare your totals with the Statistics Canada averages for context.
- Cancel or rotate fixed costs you would not choose again.
- Set a monthly cap for variable spending and track it.
- Review every three months.
For cheaper ideas, see date night ideas on a budget and cheap hobbies for adults.
Sources
- Statistics Canada, Table 11-10-0222-01, Household spending, Canada, regions and provinces, 2023, as of 1 Oct 2026. Recreation, entertainment and sub-categories by province.
- Statistics Canada, The Daily, Survey of Household Spending, 2023, released 18 Sep 2026. Updated survey weights based on the 2021 Census.
- The couple's spending in the example is an example with made-up inputs.
Frequently asked questions
How much does the average Canadian household spend on entertainment?
Statistics Canada reports average household recreation spending of $5,175 in 2023, and $880 in the narrower entertainment category, which includes movies, live events and museums.
What percentage of spending goes to recreation?
About 6.8%. Average recreation spending of $5,175 compares with $76,146 in total current consumption in 2023.
Which province spends the most on recreation?
British Columbia, at $5,977 per household in 2023, followed by Alberta at $5,641.
How much do Canadians spend on concerts and games?
Live sporting and performing arts events averaged $197 per household in 2023, and movie theatres $64.
How should I set an entertainment budget?
Track three months of spending, sort it into fixed, planned, impulse and hobby costs, cancel what you would not choose again and set a monthly cap for the rest.
Are these averages a target?
No. They include households that spend nothing and those that spend a lot. Use them for context, and set your own budget from your actual spending.
Researched and drafted with AI assistance and fact-checked against official Canadian sources. How we create content.
Disclosure: Saving Optimizer may earn a commission if a partner link is added later, such as a budgeting app offer type. No partnership is claimed on this page. Education only.